 how-to
7 Ways Third-Party Peptide Testing Protects Your Research
Last Updated: October 29, 2026
Quick Summary
Third-party peptide testing gives researchers an independent check on what is actually inside a vial, rather than relying on the supplier to grade its own product. It confirms identity, purity, and concentration for a specific batch, which matters for studies that depend on accurate dosing.
- Identity testing confirms the vial contains the compound named on the label, usually via mass spectrometry.
- Purity testing, often by HPLC, shows how much of the sample is the target compound and how much is impurities.
- Check that the batch number on the certificate of analysis matches the batch number on your vial.
- Ask for the raw chromatogram and mass spectrum, not just a final purity percentage.
- A report should document blanks, standards, and replicates before you can weigh its results.
Table of Contents
- What Third-Party Peptide Testing Means for Research Use
- Why Peptide Identity Testing Matters for Study Validity
- How Peptide Purity Testing Reveals Impurities and Concentration
- How to Read an HPLC Chromatogram from a Peptide Batch Report
- What a Peptide Certificate of Analysis Should Include
- Batch-Level Testing and Its Practical Limitations
- Requesting Janoshik-Verified Batch Reports for Your Next Order
- Frequently Asked Questions
Third-party peptide testing gives researchers an independent check on what is actually inside a vial. For a study that depends on accurate dosing, that check matters. This guide explains what third-party testing covers and where its limits are.
What Third-Party Peptide Testing Means for Research Use
Third-party testing means an independent laboratory analyzes a sample, rather than the supplier grading its own product. The lab reports what it measured, including identity, purity, and concentration. The results are only as useful as the batch they describe, which is why batch identification matters.
A supplier's own certificate and an independent report answer different questions. Reading the two together gives a clearer picture than either one alone.
Why Peptide Identity Testing Matters for Study Validity
Identity testing confirms that the material in the vial is the compound named on the label. A vial labeled as one peptide but containing a different sequence will produce results that cannot be trusted, no matter how careful the protocol.
Identity is usually checked with mass spectrometry, which measures the molecular weight of the compound. A match between the measured mass and the expected mass is a basic sign the right material is present.
How Peptide Purity Testing Reveals Impurities and Concentration
Purity testing shows how much of the sample is the target compound and how much is something else. Impurities can include truncated sequences, leftover reagents from synthesis, or degradation products that formed during storage.
Purity is commonly measured by high-performance liquid chromatography (HPLC), which separates the components of a mixture so each can be detected. Concentration tells researchers how much active material is present in a given volume, which affects dose calculations.
How to Read an HPLC Chromatogram from a Peptide Batch Report
An HPLC chromatogram is a graph with two axes. The horizontal axis is retention time, usually in minutes. The vertical axis is detector response, typically absorbance in milli-absorbance units (mAU) at a set wavelength such as 214 nm or 220 nm, where the peptide backbone absorbs. Each peak is a component that eluted from the column and reached the detector at a particular time.
A step-by-step reading workflow
- Locate the main peak. The largest peak is usually the target compound. Note its retention time to the nearest hundredth of a minute, because that precision is what lets you compare runs.
- Check the retention time against the method. The report should state the expected retention time or show a reference standard run under the same method. A main peak that drifts by more than a small fraction of a minute from the standard is a flag, not a verdict.
- Measure peak area, not just height. Purity is normally reported as the main peak's area divided by the total area of all integrated peaks, expressed as a percentage. Peak height alone is misleading because a tall, narrow peak and a short, broad peak can carry very different areas.
- Inspect the impurity peaks. Small peaks before the main peak are often truncated sequences or synthesis byproducts; peaks after it are often degradation products. Their combined area relative to the main peak is the practical purity estimate.
- Evaluate peak shape and resolution. A sharp, symmetrical peak suggests a well-behaved method. Broad, fronting, or split peaks can signal co-elution, column overload, or a sample problem. Resolution between two adjacent peaks is what tells you whether they are truly separate components or one merged blob.
- Confirm the baseline. A flat, steady baseline makes integration trustworthy. A sloping or noisy baseline inflates or deflates peak areas and should be noted before you rely on the percentage.
Connecting the chromatogram to the mass spectrometry data
A chromatogram alone does not confirm identity. The mass spectrometry data in the same report is what closes that loop, and the two datasets should be read together rather than separately:
- Retention-time alignment. The peak you identified on the chromatogram should correspond to the signal in the mass spectrum acquired at that same retention time. If the MS signal appears at a different time, you may be looking at two different components.
- Extracted-ion chromatograms. Many reports include an extracted-ion chromatogram (EIC) that plots only the signal for a specific mass-to-charge ratio (m/z). A clean EIC peak at the expected m/z, aligned with the main HPLC peak, is stronger evidence than either trace alone.
- Precursor ion. The precursor ion is the intact mass of the peptide (often as a multiply charged ion, such as [M+2H]2+ or [M+3H]3+). Its measured m/z should match the expected value for the named sequence within the instrument's mass accuracy.
A worked example
Suppose a report shows a main peak at 12.4 minutes with 97.8% area purity, a small shoulder at 11.9 minutes, and an EIC peak at the expected m/z that aligns with the 12.4-minute peak. The interpretation is: the target compound is present at high purity, the shoulder is a minor impurity or co-eluting component, and the aligned EIC supports identity. Now suppose the EIC peak instead appears at 11.9 minutes. The main HPLC peak and the MS evidence no longer agree, and the report should be read as a flag for co-elution or a mislabeled peak rather than as a clean result.
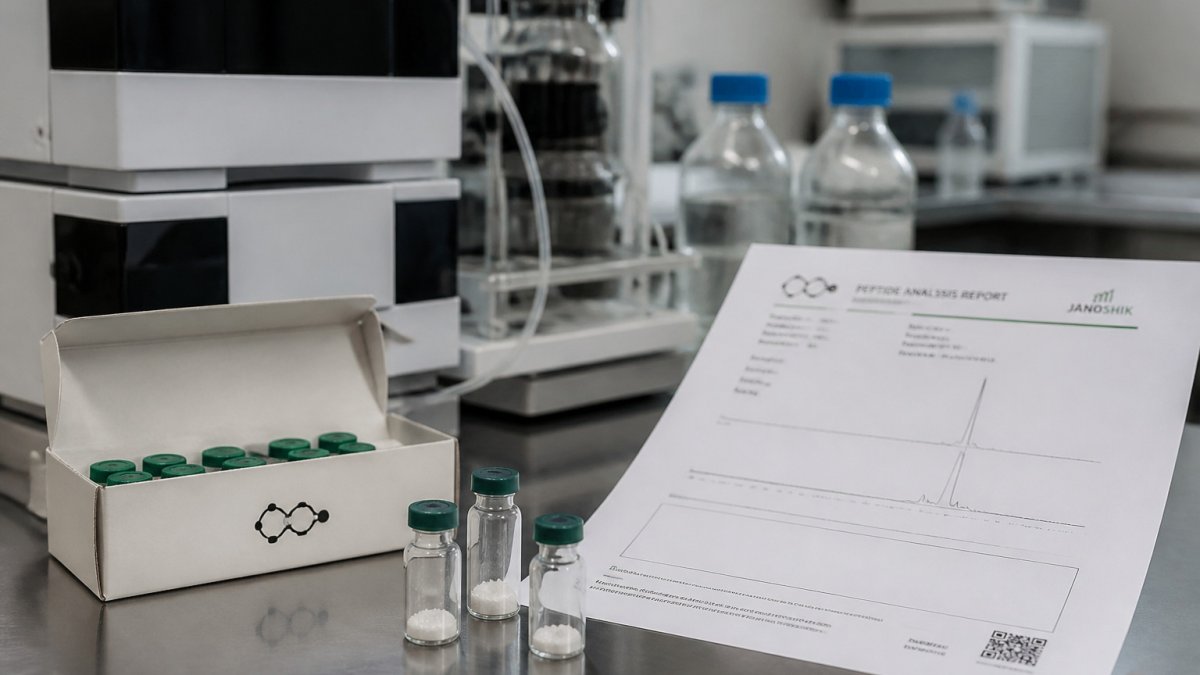
Reading the chromatogram is the first half of the job. Pairing it with the mass spectrometry data in the same report is what makes the result usable.
The article breaks chromatogram review into a short workflow, and the table below condenses each step with what to check.
| Step | What to check | Why it matters |
|---|---|---|
| Locate the main peak | Largest peak and its retention time | Usually the target compound |
| Check retention time | Match to expected time or reference standard | A large drift is a flag |
| Measure peak area | Area, not height, as a percentage | Height alone is misleading |
| Inspect impurity peaks | Peaks before and after the main peak | Show truncations or degradation |
| Evaluate peak shape | Sharp, symmetrical, well-resolved peaks | Splitting can signal co-elution |
| Confirm the baseline | Flat, steady baseline | Sloping noise distorts integration |
What a Peptide Certificate of Analysis Should Include
A certificate of analysis (COA) summarizes the testing for a batch. A complete COA usually lists the batch number, the tested compound, the testing methods, the purity result, the identity result, and the date of testing. Step-by-step guide to reading COA documents walks through each of these fields.
Check that the batch number on the COA matches the batch number on your vial. A COA that cannot be tied to a specific batch has limited value. Note also which laboratory performed the testing, since that determines how much weight the result can carry.
Batch-Level Testing and Its Practical Limitations
Testing one batch does not guarantee every vial from another batch will match. Results describe the sample that was tested, and variation can occur between production runs. Third-party testing reduces uncertainty but does not remove it. What separates a strong report from a weak one is whether the laboratory documented the quality controls that make its numbers meaningful.
Quality controls a credible report should document
- Blanks. A blank run (no sample, or a matrix-only blank) shows what the instrument and reagents contribute on their own. Peaks that appear in the blank are not sample components, and a report that omits blank data gives you no way to tell the difference.
- Standards and calibration. A reference standard run under the same method anchors retention time and response. A calibration curve, built from standards at known concentrations, is what allows a concentration to be estimated rather than merely detected.
- Replicates. Running the same sample more than once shows whether a result is stable. A single injection is one data point; replicate injections reveal the spread.
Reading uncertainty instead of a single number
A purity figure such as 97.8% is an estimate, not a certainty. Its reliability depends on the method's detection limits, the integration choices made by the analyst, and the controls listed above. When a report shows replicate results, look at the spread: tight agreement supports confidence, while a wide spread means the number should be treated as approximate. When a report shows a calibration curve, look at whether the sample falls within the calibrated range; a result outside that range is an extrapolation.
Common interpretation pitfalls
- Co-elution. Two components that leave the column at nearly the same time can appear as one peak, hiding an impurity. Resolution between adjacent peaks is the check.
- Peak tailing. A tailing main peak can overlap with a later impurity and distort both the purity percentage and the impurity profile.
- Ion suppression and in-source fragmentation. In mass spectrometry, matrix components can suppress ionization, and fragile peptides can fragment before detection. Both can make a compound look absent or present at the wrong mass.
What this means for your own quality assessment
For these reasons, researchers should treat any report as one input into their own quality assessment, not as a final guarantee.
For background on how independent verification works, see our Janoshik testing overview for research peptides. If you are working through the chromatogram and mass spectrometry data in a report, the HPLC and MS interpretation guide and notes on interpreting mass spectrometry data for peptides cover the remaining steps.
Requesting Janoshik-Verified Batch Reports for Your Next Order
When placing an order, ask for the Janoshik-verified batch report for the specific batch you are receiving. Confirm the batch number matches your vials before you rely on the report.
Frequently Asked Questions
What are the benefits of third-party peptide testing?
Third-party testing gives a research team an analytical opinion from a party that did not produce or sell the material. It can help confirm that a sample matches its stated identity, show the level of purity, and document whether a batch is consistent with others. The supplied research does not establish that testing alone guarantees product quality or valid research outcomes, so it works best as one part of a documented quality process alongside sound study design and storage practices.
What does a third-party peptide test report show?
A typical batch report includes identity information, usually from a method such as mass spectrometry, and purity information, usually from HPLC. The report may list the sample identifier, the analytical method used, and the measured results. Researchers should check that the sample ID matches the vial they received and that the report covers the batch they are using, rather than a different lot from the same supplier.
Does an HPLC result confirm peptide identity?
No. HPLC separates components in a mixture and shows how much of the sample elutes at each retention time, which supports purity assessment. It does not by itself confirm what a peak is. Identity is typically confirmed by pairing the retention time with mass spectrometry data, such as the mass-to-charge ratio of the molecular ion, so that both the separation and the molecular mass support the identification.
What is the difference between peptide purity and identity?
Identity asks whether the material is the compound it is labeled as. Purity asks how much of the sample is that compound versus impurities or degradation products. A sample can have a correct identity but low purity, or high purity of the wrong compound. Both need to be checked for a controlled study, which is why many teams request both identity and purity data for each batch.