 how-to
How to Interpret HPLC and MS Data Together
Table of Contents
- How to Read an HPLC Chromatogram: Retention Time, Peak Area and Peak Height
- Step 1: Confirm the Method and Sample Context Before Reading Any Peak
- Step 2: Match Each HPLC Peak to Its Mass Spectrum
- Interpreting Mass Spectrometry Peaks: Molecular Ions, Fragments and m/z
- How to Read Janoshik Reports Alongside Your Own HPLC and MS Data
- Calculating Peptide Purity Analysis From Chromatographic Area Percent
- Your Next Step: Documenting Results and Requesting Batch Data
- Frequently Asked Questions
Last Updated: October 29, 2026
How to Read an HPLC Chromatogram: Retention Time, Peak Area and Peak Height
A chromatogram is the main output of high-performance liquid chromatography (HPLC). It shows how a mixture separates into individual components over time. Each component appears as a peak, and each peak carries information about identity and amount.
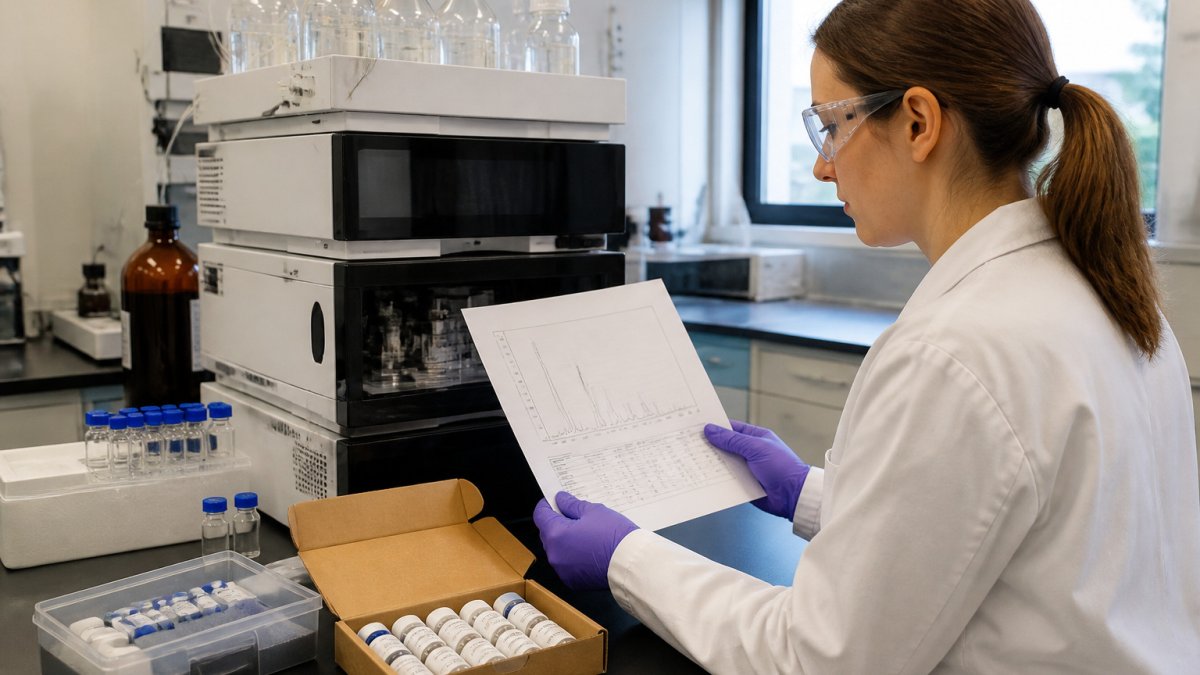
Retention time is the time a compound takes to pass through the column and reach the detector. Under the same method conditions, a given compound should elute at a consistent retention time.
Reading the Axes and Identifying Peaks
The horizontal axis shows time, usually in minutes. The vertical axis shows detector response, often in absorbance units for UV detection. Each peak rises above the baseline when a compound reaches the detector.
Follow these habits when reading peaks:
- Check that the baseline is flat before and after the peaks of interest
- Note the retention time at the peak apex
- Compare retention times against a reference standard run under the same conditions
- Flag any peak that appears in a blank injection, since it may come from the solvent or system
Peak Shape, Width and Resolution
Good peaks are narrow and roughly symmetrical. Tailing or fronting peaks often signal column problems, a mismatch between sample solvent and mobile phase, or overloading. Peak width affects resolution, which measures how well two neighboring peaks are separated. Poor resolution makes peak areas unreliable, because the peaks overlap and the software may integrate them incorrectly.
Step 1: Confirm the Method and Sample Context Before Reading Any Peak
Before you interpret any peak, confirm the context of the run. A peak means little without knowing the method that produced it.
Check these items first:
- The column type and dimensions
- The mobile phase composition and gradient program
- The detection wavelength or detector type
- The injection volume and sample solvent
Record these details alongside your data. Without them, a retention time or peak area cannot be reproduced or compared later.
Step 2: Match Each HPLC Peak to Its Mass Spectrum
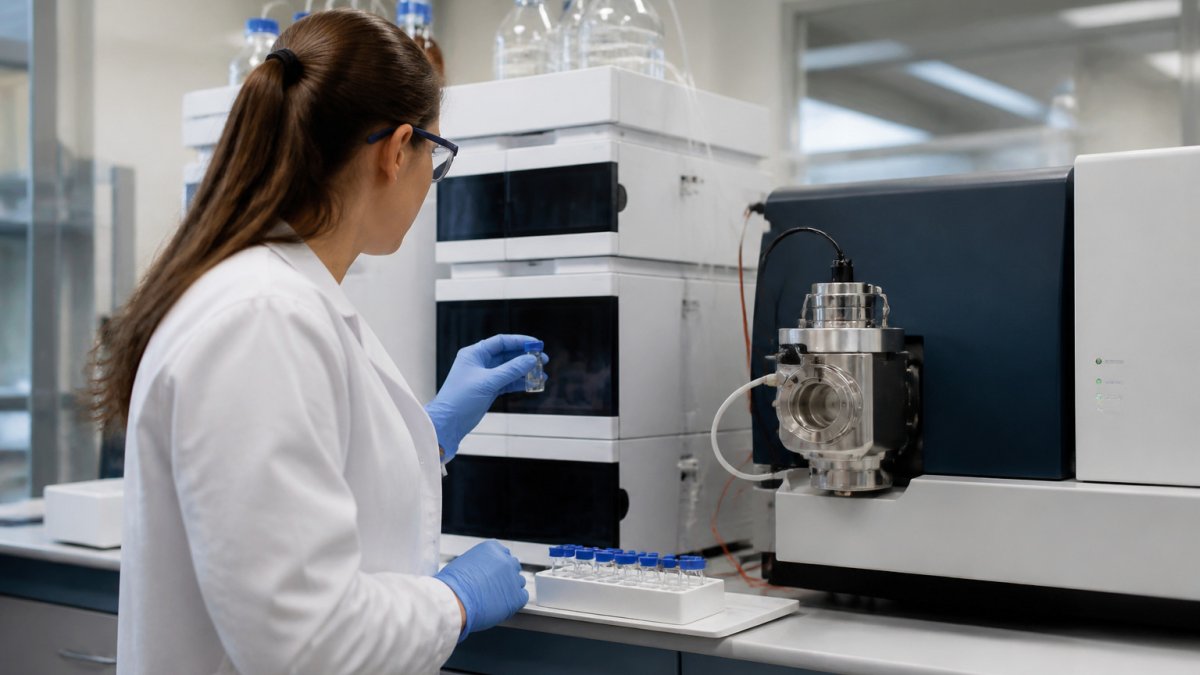
Mass spectrometry (MS) adds a second layer of information. When HPLC is coupled to MS, each eluting peak can be matched to a mass spectrum that reports mass-to-charge ratios (m/z).
Matching is the core of how to interpret HPLC and MS data from a coupled run, and it works best when you:
- Align the MS total ion chromatogram with the HPLC trace, accounting for the delay between the detector and the mass spectrometer
- Extract the mass spectrum at the retention time of each peak apex
- Confirm the expected molecular ion appears in that spectrum
- Check that the peak's m/z values are not present in the blank run
Retention time alone cannot confirm identity, since different compounds can co-elute. Mass data helps separate them.
Interpreting Mass Spectrometry Peaks: Molecular Ions, Fragments and m/z
A mass spectrum plots m/z on the horizontal axis against ion abundance on the vertical axis. Reading it well means separating the signals that describe the intact molecule from those that describe how it broke apart, and knowing which features are artifacts of the method rather than the sample.
The molecular ion and its adducts
The molecular ion is the ion formed from the intact molecule. Its m/z value gives the molecular mass adjusted for charge state. In electrospray ionization (ESI), the intact species rarely appears as a bare ion. Common adducts include:
- [M+H]+, protonated molecule, the most common positive-mode ion
- [M+Na]+ and [M+K]+, sodium and potassium adducts, often from glassware, salts, or mobile-phase additives
- [M+NH4]+, ammonium adduct, common with ammonium acetate or ammonium formate buffers
- [M−H]−, deprotonated molecule in negative mode
A peak that sits 22 Da above the protonated molecule is a strong hint for a sodium adduct, not a separate compound. Before you assign an unknown peak, calculate the expected m/z for the likely adducts at the charge state you observe and check whether any match.
Isotope patterns as a confirmation tool
Most elements have naturally occurring heavier isotopes. Carbon-13 is about 1.1% of natural carbon, so a molecule with roughly 60 carbons shows an M+1 peak about 66% the height of the monoisotopic peak. The pattern is predictable:
- A single-carbon difference shows up as an M+1 peak near 1.1% per carbon
- Chlorine and bromine produce distinctive M+2 patterns (about 3:1 for one chlorine, about 1:1 for one bromine)
- Sulfur adds a smaller M+2 contribution
If the observed isotope envelope does not match the expected elemental composition, the assignment is probably wrong, even if the nominal mass matches.
Fragment ions and what they tell you
Fragment ions form when the molecule breaks apart during ionization or in the collision cell. Their pattern helps confirm structure. In-source fragmentation (fragments formed before the mass analyzer, in the ion source) can mislead you into thinking a sample contains a compound it does not. A practical check: if a "fragment" peak changes intensity when you lower the source voltage or capillary temperature, it is likely in-source fragmentation rather than a true sample component.
Tandem MS (MS/MS) and identification confidence
Tandem mass spectrometry selects a precursor ion, fragments it in a collision cell, and records the product ions. Product ion spectra give stronger evidence for identity than a single MS scan because the fragmentation pattern is more specific. When you interpret MS/MS:
- Confirm the precursor m/z matches the expected molecular ion (accounting for adducts and charge state)
- Check that the major product ions are consistent with the expected fragmentation pathway
- Compare against a reference standard run under the same collision energy, library matches alone are weaker evidence, because collision energy, instrument type, and adduct state change the spectrum
- Treat a library match as a hypothesis, not a confirmation, unless the match score is high and the retention time also agrees
Ionization mode and polarity choices
Positive mode favors protonation and works well for basic compounds and many peptides; negative mode favors deprotonation and suits acidic compounds. Switching polarity can reveal a compound that was invisible in the other mode, but it also changes adducts and fragmentation. Record the polarity, source voltage, and collision energy alongside every spectrum, because a spectrum without those parameters cannot be reproduced or compared.
How to Read Janoshik Reports Alongside Your Own HPLC and MS Data
When you compare your own HPLC and MS results against a Janoshik report, match the batch identifier first. Then compare the main peak's retention time, the reported purity, and any impurity peaks.
Differences can come from method conditions, column age, or integration choices. Note these differences rather than forcing a match.
Calculating Peptide Purity Analysis From Chromatographic Area Percent
Peptide purity analysis in HPLC is often reported as area percent. The formula is:
Area percent = (Area of main peak ÷ Total area of all peaks) × 100
Use these steps:
- Integrate every peak above the baseline, excluding the solvent front
- Sum the areas of all integrated peaks
- Divide the main peak area by the total area
- Multiply by 100 to get the percentage
Area percent assumes that all components respond equally at the detector. Impurities with weak UV absorbance can be underestimated, and a co-eluting impurity hidden under the main peak is invisible to area percent entirely. Our overview of peptide purity testing methods explains where this measure fits among other approaches. For reading the document that reports these values, see our step-by-step COA guide.
Why area percent alone is not a purity claim
Area percent is a relative measure. It tells you the share of detector response, not the share of mass. Three factors commonly distort it:
- Response factors, different compounds absorb differently at the detection wavelength, so equal masses can give unequal areas
- Co-elution, an impurity that elutes at the same retention time as the main peak is counted as part of the main peak
- Wavelength choice, a wavelength that favors the main peptide may under-detect impurities that absorb elsewhere
A common pattern is to report area percent at one wavelength and call it purity. That is a convention, not a validated measurement, unless the method has been checked against a reference standard of known purity.
The validation checks that make the number trustworthy
Before you rely on an area-percent figure, your own or one from a report, confirm these checks were done:
- Blank injection, a solvent blank run under the same method should show no peaks at the retention times of interest; peaks in the blank point to solvent, system, or carryover contamination
- System suitability, replicate injections of a standard should give consistent retention times and peak areas; drifting retention or area signals a method or instrument problem
- Calibration curve, a series of standards at known concentrations establishes the linear range; area percent is only meaningful inside that range
- Replicates, at least duplicate injections of the sample, so you can see the run-to-run variation rather than trusting a single number
Uncertainty and how to report it
Even a well-run method has uncertainty. Report the area percent with the conditions that produced it: detection wavelength, integration parameters (baseline settings, threshold, smoothing), number of injections, and whether a standard was used. Two labs can report different area-percent values for the same batch simply because their integration settings differ. When you compare a result against a Janoshik report, note the method differences rather than forcing a match, a small gap is often method-driven, while a large gap warrants a closer look at the raw data.
The steps for calculating area percent are summarised below.
| Step | What to do | Note |
|---|---|---|
| 1 | Integrate every peak above the baseline | Exclude the solvent front |
| 2 | Sum the areas of all integrated peaks | Total area of all peaks |
| 3 | Divide the main peak area by the total area | Main peak area ÷ total area |
| 4 | Multiply by 100 | Gives the percentage |
Your Next Step: Documenting Results and Requesting Batch Data
Record each run with the method conditions, the batch identifier, the retention times, the peak areas, and the MS data for each major peak. Keep the raw files, not just the summary figures.
If your interpretation depends on batch-level consistency, request the batch data from the supplier before you draw conclusions. Storage conditions also affect results over time, so plan repeat analyses with that in mind.
Frequently Asked Questions
What does a peak in an HPLC chromatogram represent?
A peak represents a compound, or group of compounds, that reached the detector at a specific retention time after separating from the rest of the sample on the column. Its position on the time axis helps identify the compound under a fixed method, and its area or height relates to how much of that compound is present. A clean, well-resolved peak with a stable baseline is far easier to interpret than a broad or overlapping one, so check peak shape before drawing conclusions from its size.
How do you determine peptide purity from HPLC data?
Peptide purity is commonly estimated by dividing the area of the main peptide peak by the total area of all integrated peaks, then multiplying by 100 to give a percentage. Peaks from impurities, truncated sequences or degradation products reduce this value. Confirm with the mass spectrum that the main peak carries the expected molecular mass, since a single peak can still hide co-eluting species. Always report the integration settings used, because they affect the result.
How do you read a mass spectrometry spectrum for peptides?
Start by locating the molecular ion or the expected charge-state series, which appears as a set of peaks at different m/z values for multiply charged peptides. Calculate the neutral mass from the m/z and charge to compare it with the theoretical mass of the target sequence. Fragment ions from MS/MS can then support the sequence assignment. Check the mass accuracy and isotope pattern before accepting an identification.
Why is third-party verification important for research peptide data?
Third-party verification means an independent analytical result is checked against the supplier's own claims, which reduces reliance on a single source of data. For research use, this helps confirm identity and purity before a compound enters an experiment, so downstream results are not built on unverified material. Reviewing the actual chromatogram and mass data, rather than only a summary percentage, gives a clearer picture of what the sample contains.